ARCHEOLOG-HOME / INDIana-UNIversitas
Contact


Human mortality improvement in evolutionary context
Oskar Burger, Annette Baudisch, and James W. Vaupel
Life expectancy is increasing in most countries and has exceeded 80 in several, as low-mortality nations continue to make progress in averting deaths.
The health and economic implications of mortality reduction have been given substantial attention, but the observed malleability of human mortality has not been placed in a broad evolutionary context.
We quantify the rate and amount of mortality reduction by comparing a variety of human populations to the evolved human mortality profile, here estimated as the average mortality pattern for ethnographically observed hunter-gatherers.
We show that human mortality has decreased so substantially that the difference between hunter-gatherers and today’s lowest mortality populations is greater than the difference between hunter-gatherers and wild chimpanzees.
The bulk of this mortality reduction has occurred since 1900 and has been experienced by only about 4 of the roughly 8,000 human generations that have ever lived.
Moreover, mortality improvement in humans is on par with or greater than the reductions in mortality in other species achieved by laboratory selection experiments and endocrine pathway mutations.
This observed plasticity in age-specific risk of death is at odds with conventional theories of aging.
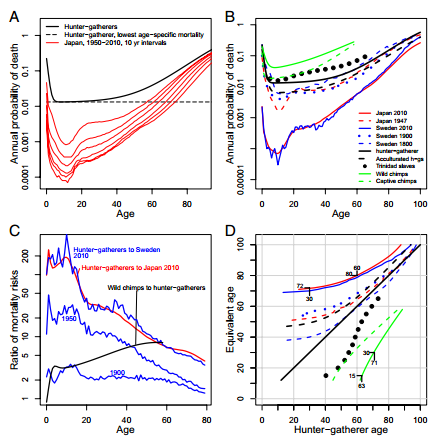
Fig. 1. (A) Annual probability of death for hunter-gatherers compared with today’s longest living nation, Japan, at 10-y intervals through time. (B) Annual probability of death for a variety of human populations, along with wild and captive chimpanzees. The difference between present-day Japan and the Trinidadian slaves frames nearly all of the known variation in mortality across human populations. The hunter-gatherer curve approximates the typical human mortality profile over evolutionary time. (C) Ratio of mortality risks. Each curve gives the ratio of annual probabilities of death by age; hunter-gatherers to Sweden 1900, 1950, and 2010 in blue; hunter-gatherers to Japan 2010 in red; and wild chimps to hunter-gatherers in black. The magnitude of improvement of Japan 2010 and Sweden 2010 over the evolutionarily typical pattern for hunter-gatherers is much greater than the gap between hunter-gatherers and chimpanzees. (D) Ages of equivalent mortality. Each of the populations in B is compared with hunter-gatherers in terms of equivalent age. For each of the populations, the x-axis is hunter-gatherer age and the y-axis is the age at which each population has the probability of death equivalent to that of hunter-gatherers. Lines above the diagonal are for populations with lower mortality than hunter-gatherers. Lines below the diagonal are for populations with higher mortality than hunter-gatherers. Examples are indicated with ages and black dashes. For instance, reading upward from the middle of the x-axis to the top of the plot, we see that a hunter-gatherer at age 60 has the same probability of death as an individual in Japan at age 80. All curves are based on raw data except the Trinidad population and Sweden 1800, which were smoothed with a loess function for plotting purposes only. Data sources are as follows: Japan (17, 39); Sweden (17); Trinidad (37); hunter-gatherers, acculturated hunter-gatherers, wild and captive chimps are based on Siler functions from Gurven and Kaplan (3). In all cases, mortality is for the total population, both sexes combined. Note logarithmic increments on the y-axis in A–C