ARCHEOLOG-HOME / INDIana-UNIversitas
Contact


A 3-D geometric morphometric study of intraspecific variation in the ontogeny of the temporal bone in modern Homo sapiens
Heather F. Smith, Terrence Ritzman, Erik Otárola-Castillo, Claire E. Terhune
Source -http://www.sciencedirect.com/science/article/pii/S0047248413001425
Journal of Human Evolution
Abstract
This study addresses how the human temporal bone develops the population-specific pattern of morphology observed among adults and at what point in ontogeny those patterns arise. Three-dimensional temporal bone shape was captured using 15 landmarks on ontogenetic series of specimens from seven modern human populations. Discriminant function analysis revealed that population-specific temporal bone morphology is evident early in ontogeny, with significant shape differences among many human populations apparent prior to the eruption of the first molar. As early as five years of age, temporal bone shape reflects population history and can be used to reliably sort populations, although those in closer geographic proximity and molecular affinity are more likely to be misclassified. The deviation of cold-adapted populations from this general pattern of congruence between temporal bone morphology and genetic distances, identified in previous work, was confirmed here in adult and subadult specimens, and was revealed to occur earlier in ontogeny than previously recognized. Significant differences exist between the ontogenetic trajectories of some pairs of populations, but not among others, and the angles of these trajectories do not reflect genetic relationships or final adult temporal bone size. Significant intrapopulation differences are evident early in ontogeny, with differences becoming amplified by divergent trajectories in some groups. These findings elucidate how the congruence between adult human temporal bone morphology and population history develops, and reveal that this pattern corresponds closely to that described previously for facial ontogeny.
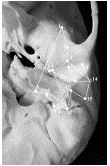
Figure 1. Fifteen temporal bone landmarks digitized in the present study, following Lockwood et al. (2004). Please see Table 2 for landmark definitions. The open circle for landmark #14 indicates its approximate position, as it is not directly visible from this perspective.
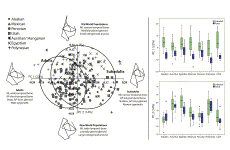
Figure 2. Bivariate plot of PC axes one (x-axis) and two (y-axis) showing population and age variation in the sample. Confidences ellipses encompass 90% of the shape variation for the subadult and adult samples. Box plots on the right hand side of the figure show the distribution of PC scores for PC axes 1 (top) and 2 (bottom) by population and for the subadult and adult samples separately. Darkened bars represent the median for each group, the boxes indicate the interquartile range (25th–75th percentiles), and the whiskers extend to 1.5 times the interquartile range. Outliers are indicated by circles and extremes are indicated by asterisks.