ARCHEOLOG-HOME / INDIana-UNIversitas
Contact


Londres (G-B): the city's near-2,000 year history mapped
Flora Roumpani / Polly Hudson
Researchers at UCL's Centre for Advanced Spatial Analysis collated vast datasets to map the capital's transformation from first-century Londinium to modern megacity
How did London evolve from its creation as a Roman city in 43AD to the crowded, chaotic megacity we see today? The London Evolution Animation takes a holistic view of what was built in the capital during different historical periods – what has been lost, what saved and what protected.
Greater London covers 600 square miles, however up until the 17th century the capital was largely crammed into a single square mile, marked by the skyscrapers of the financial City today.
The visualisation, originally created for the Almost Lost exhibition by the Bartlett Centre for Advanced Spatial Analysis (Casa), explores the development of the city through the evolution of the road network and preserved buildings.
Unlike other historical cities such as Athens or Rome, where there is an obvious patchwork of areas from different periods, London's scheduled sites and listed buildings are individual structures, in many cases assembled gradually by parts from many different periods. Those who try to locate different historic structures will know that these features appear as pieces of different jigsaw puzzles, scattered across the contemporary city.
The animation took nine months to make, using a variety of methods and data from several sources. The Museum of London Archaeology provided datasets for the Roman and Medieval periods as well as the 17th and early 18th centuries. The University of Cambridge’s engineering department contributed road network datasets from the late 18th century to today. An additional Tudor layer was based on a map of London in 1520 from the Historic Towns Trust; data on the city’s 19,000 listed buildings and 156 scheduled monuments came from English Heritage; and buildings data was drawn from the Ordnance Survey.
In the visualisation, new road segments appear gradually over an image of faded contemporary London. For each period, gradually enlarging yellow points highlight statutorily protected buildings and structures.
The animation has also provided a starting point for the development of a virtual model which will enable us to better understand and anticipate the wider impact of development on London’s historic fabric. We are currently working on a 3D version.
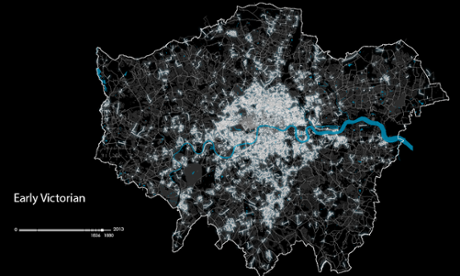
Early Victorian London. Brighter white lines show new roads built during the period
The greatest preserved feature of the city is its own urban fabric. London started its evolution with the Roman creation of Londinium and some of the main axes of the contemporary city, such as Oxford Street, are still with us.
London was abandoned in 410AD and under the Saxons isolated farmsteads were built in the surrounding countryside. Some of these – such as Enfield, Hampton and Chelsea – grew to form the heart of villages which still act as centres in modern London.
From the 9th century, London grew again within its original Roman boundary, and during the Norman period it was connected by the Strand to a new political centre at Westminster. By this time most of Roman London had been lost, with its many timber buildings decayed and its stone buildings reused. Today, virtually nothing from the Roman period exists above ground, though beneath street level many important archaeological remains survive.
During the Medieval period plagues and famines significantly restricted population growth, however under the Tudors, London’s population increased to around 200,000. Following Henry VIII’s demolition of London’s religious houses, significant new development occurred, and a number of royal retreats were built away from the centre: Hampton Court and Eltham Palace survive.
The Great Fire of 1666 destroyed four-fifths of the city and more than 13,000 medieval, Tudor and early-17th century buildings were lost. As a result only a tiny proportion of pre-1700 London buildings and structures exist today; all those that survive largely intact are protected and their location is shown in the animation.
Between 1714 and 1840, London’s population swelled from around 630,000 to nearly 2 million, making it the largest and most powerful city in the world.

The Polygon of Somers Town in an etching from 1850. It was demolished in the 1890s and a modern housing estate occupies the site. Photograph: Alamy
A significant proportion of Georgian structures survive today, even though commercial development in the first half of the 20th century destroyed many.
The Victorian period found London expanding once more, as the population grew from around 2 million to 6.5 million. The opening of the London Underground in 1863 effectively cut distances and enabled residents to leave the crowded centre for more spacious suburban developments. Despite a culling of Victorian buildings between the 1940s and 70s, the sheer scale of development has led a much higher survival rate.
The population peaked in 1940 at around 8.5 million, before declining and then rising recently to just over 8 million. Despite the decline and the devastation caused by the second world war, the 20th century saw the largest urban expansion in London’s history.
VIDEO : The London Evolution Animation